














If you opened your solar app this month and the August bar looked short, you didn’t imagine it and nothing is broken. Depending on where you live, either the sky took a cut or the dust did.
Only one of those is worth a phone call. It is not the one somebody will try to sell you.
Solcast, the irradiance data arm of DNV, ran August for North America. Across much of the Upper Midwest and Great Lakes, it found global horizontal irradiance “as much as 15-17% below average,” with Chicago posting “a 17% negative anomaly.” Toronto was down 10%, Buffalo 8%. Global horizontal irradiance is the total sunlight energy landing on a flat surface, which is the closest thing your roof has to a fuel gauge.
Blame a stubborn high-pressure ridge parked near the Four Corners and a low sitting over Ontario. The ridge burned the clouds off the south-central states, so Texas and Oklahoma ran about 10% above average during one of their five driest Augusts. The Pacific Northwest came in around 5% up, though wildfire smoke quietly took 1 to 2% of that back.
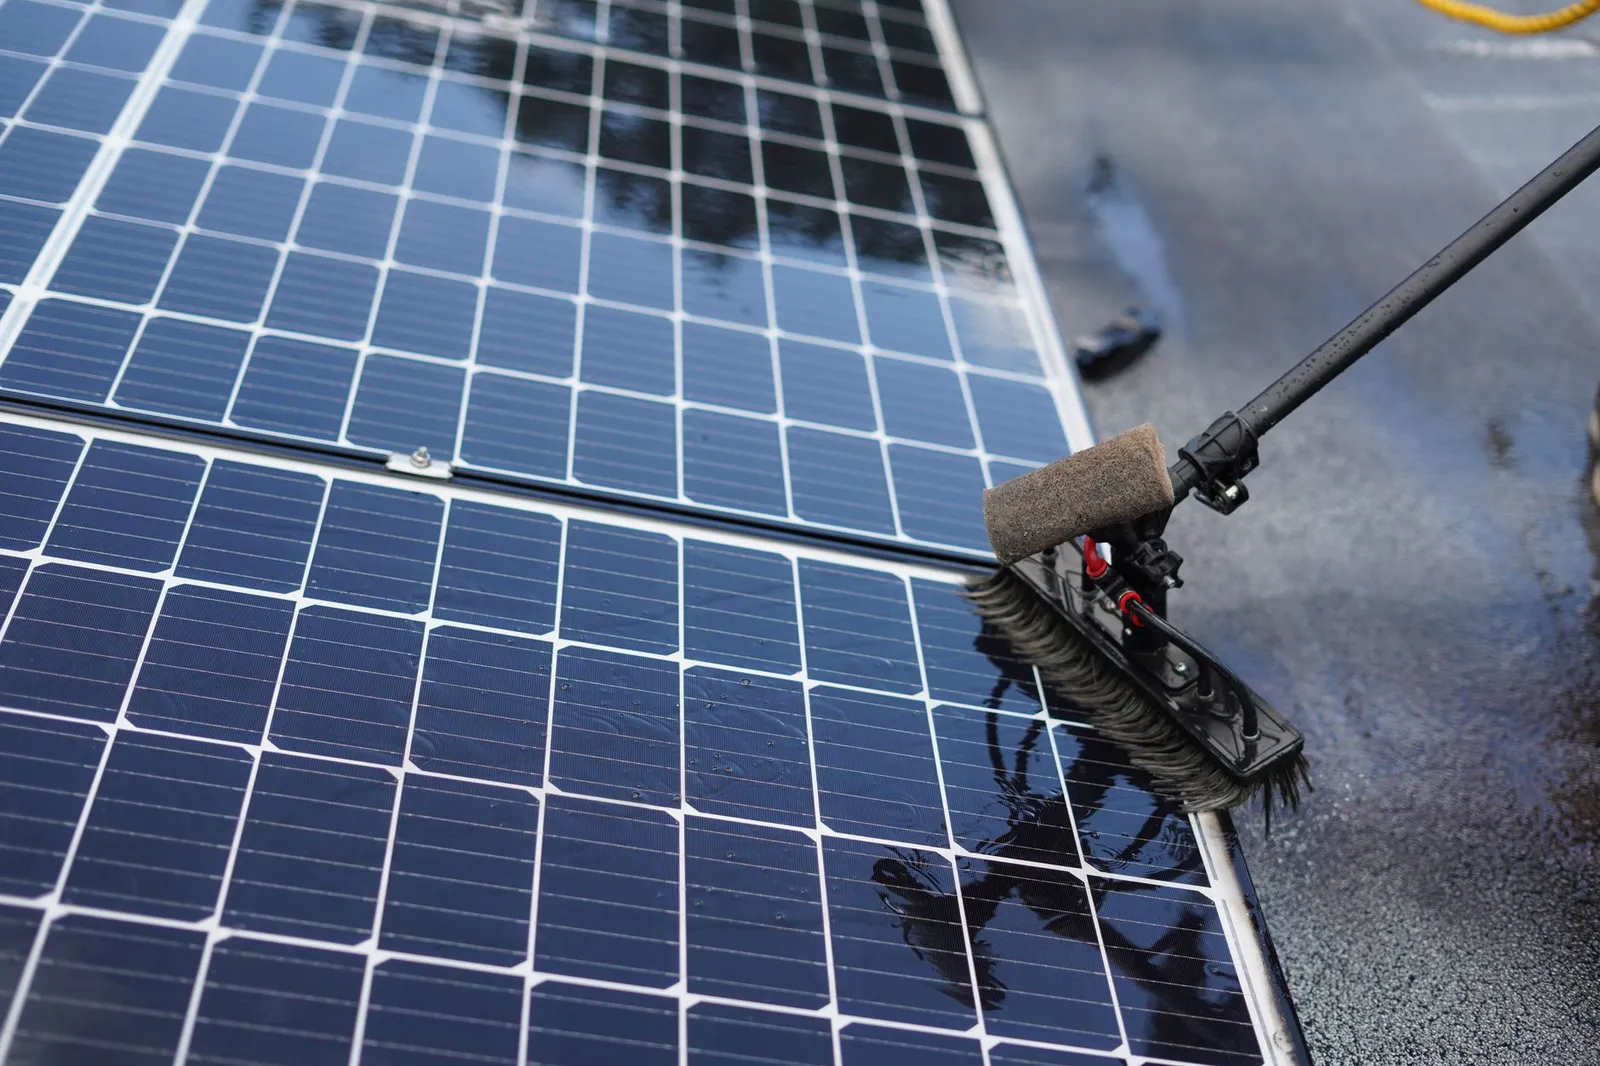
Then there’s Dallas, where the dry spell did something else. Solcast reports that “modeled soiling loss rose towards 2% by the end of August, the highest late-August value in the 2007-2026 series.” A record.
Read the reason before you reach for your wallet. The rise “primarily reflected the absence of rainfall to wash accumulated material from modules, rather than unusually high deposition rates.” Translation: the same dirt as always, and no rain to rinse it off.
Now put money on all of it. The average Illinois home paid 19.89 cents per kilowatt-hour in June, the most recent month the EIA has published, against 15.94 cents in Texas. So every 100 kWh your array didn’t make last month cost you roughly $20 in Illinois and $16 in Texas, assuming your utility still credits exports at the full retail rate. On an array that would have produced 1,000 kWh in a normal August, Chicago’s 17% miss is about 170 kWh, or $34. One month, gone, with nobody to bill for it.
The dirt is a different story. Two percent of that same 1,000 kWh is 20 kWh, which in Texas is $3.19.
Three dollars and nineteen cents. That’s the worst late-summer soiling in a twenty-year record, and that is the number any panel-washing quote has to beat. Paying a crew to climb your roof and recover it is dumb math. The data says rain is the variable, and rain is free.
So check the shape of your drop instead of the size of it. Weather makes a smooth, whole-system dip that your neighbors share. A dead string or a failed optimizer makes a step: one section flatlines while the rest of the array keeps its normal curve. If your monitoring breaks out strings or panels, that comparison takes about two minutes.
If you lease or you’re on a power purchase agreement with a production guarantee, go find that clause today. Note the measurement window and whether the guaranteed number gets adjusted for actual weather. One dark month is almost never a claim on its own, and knowing the window tells you when the number actually matters.
Mark your annual true-up date too, because that is when a weak summer shows up as credits you never get to use.
Still shopping? Run your own numbers with our solar calculator and the financing breakdown in our solar hub, not an installer’s printout from a good month.
One last curiosity from the August data. Hurricane Lala dropped more than 200% of average August rainfall on Hawaii, and the state’s monthly irradiance still came in only 4% below normal.
How Candid Yak makes money. Some of the products we write about pay us if you apply or sign up through our links. That never changes our verdict, our rankings, or the numbers in this article. We call a bad deal a bad deal whether it pays us or not. Some brands shown in our comparison tools are placeholder examples while we finalize partner agreements, and we label them as such.
Sources
- Dry August pushes Dallas soiling losses towards 2% as North American GHI diverges (Solcast, a DNV company, via pv magazine USA, September 18, 2026)
- Table 5.6.A. Average Price of Electricity to Ultimate Customers by End-Use Sector, by State, June 2026 and 2025 (U.S. Energy Information Administration, Electric Power Monthly)